
Solution
Combine mapping and surveys
Import vector data, rasters and elevation models, or connect WMS or WMTS services such as satellite imagery and vegetation indices, and see them over the survey, in the same coordinate system.
Product
What it's for
Read the survey with the mapping you already have.
Overlay geological maps, boundaries, samples and other maps on the survey to prepare fieldwork and relate observations.
Drag to see the overlaid mapping.
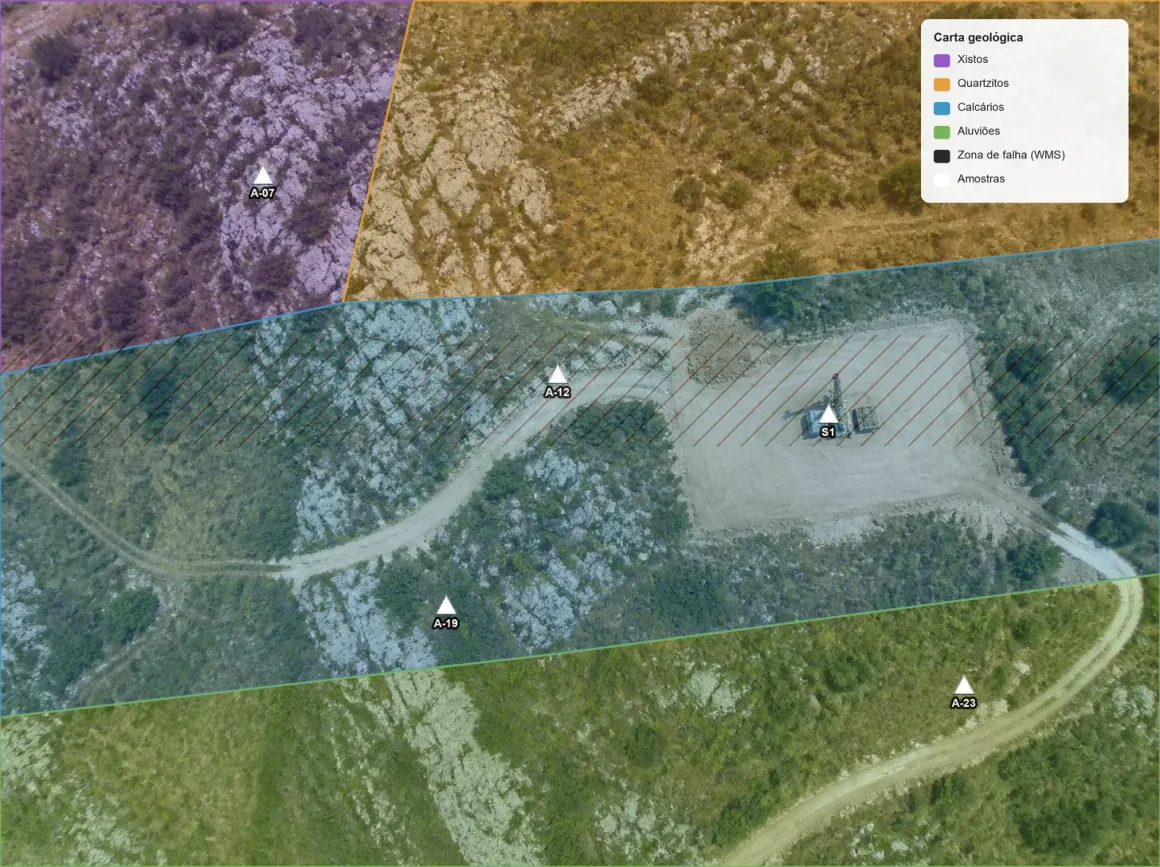
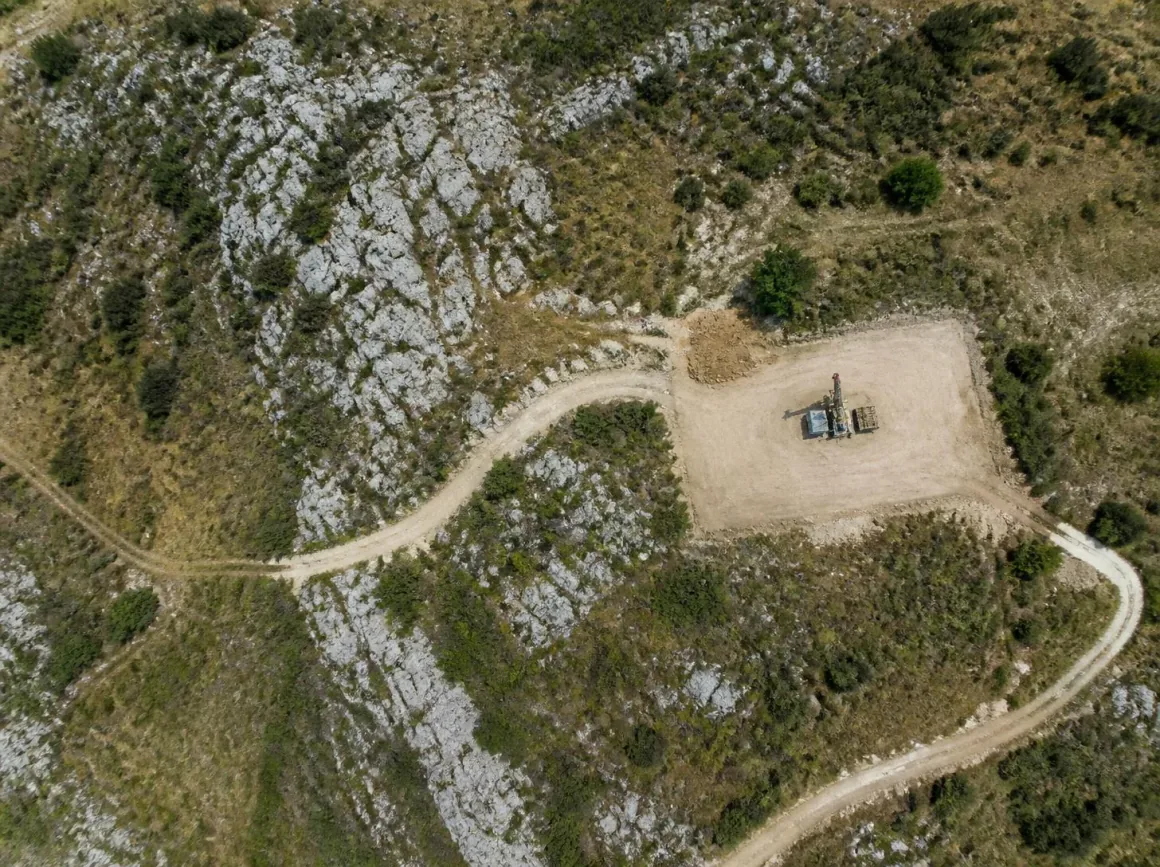 SurveyWith your mapping
What you need
Your existing mapping and a survey of the site.
Each source needs its coordinate system identified. WMS or WMTS services connect by their address.
Step by step
- 01
Upload
Upload data or the results from each flight.
- 02
Process
Turn data into results.
- 03
Compare
Compare surveys and see what changed.
- 04
Measure
Measure areas, distances and volumes.
- 05
Share
Share the result with your client or a colleague.
Results
Everything on one map, in one system.
You keep the survey and your mapping aligned, in layers you switch on and off, ready to look up, share or export.
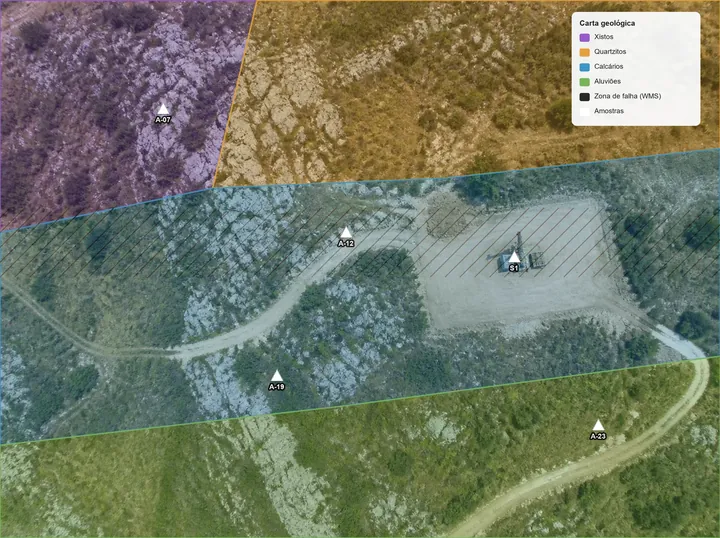
Mapping over the survey
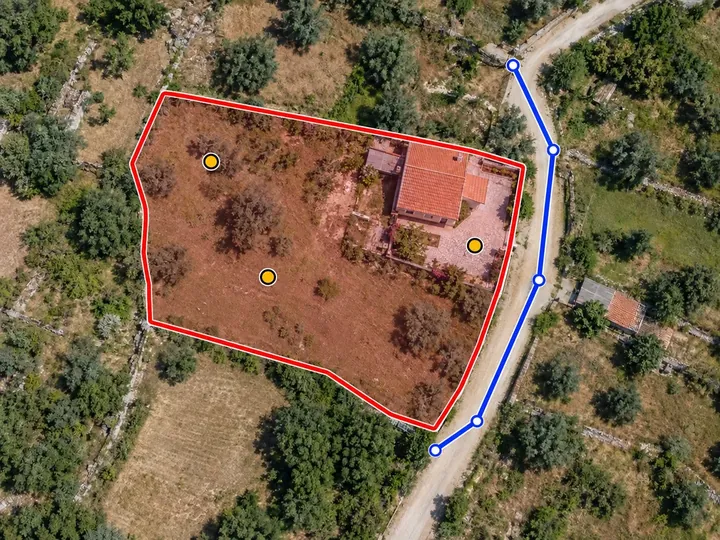
Satellite imagery and NDVI via WMS
Samples and observation points
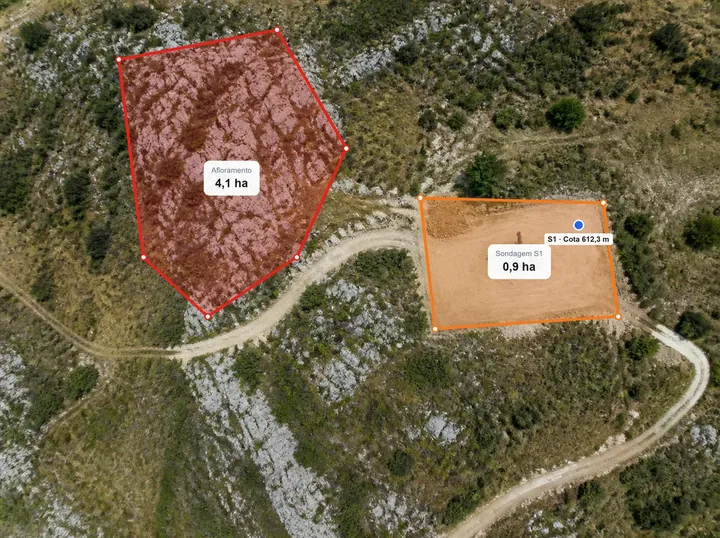
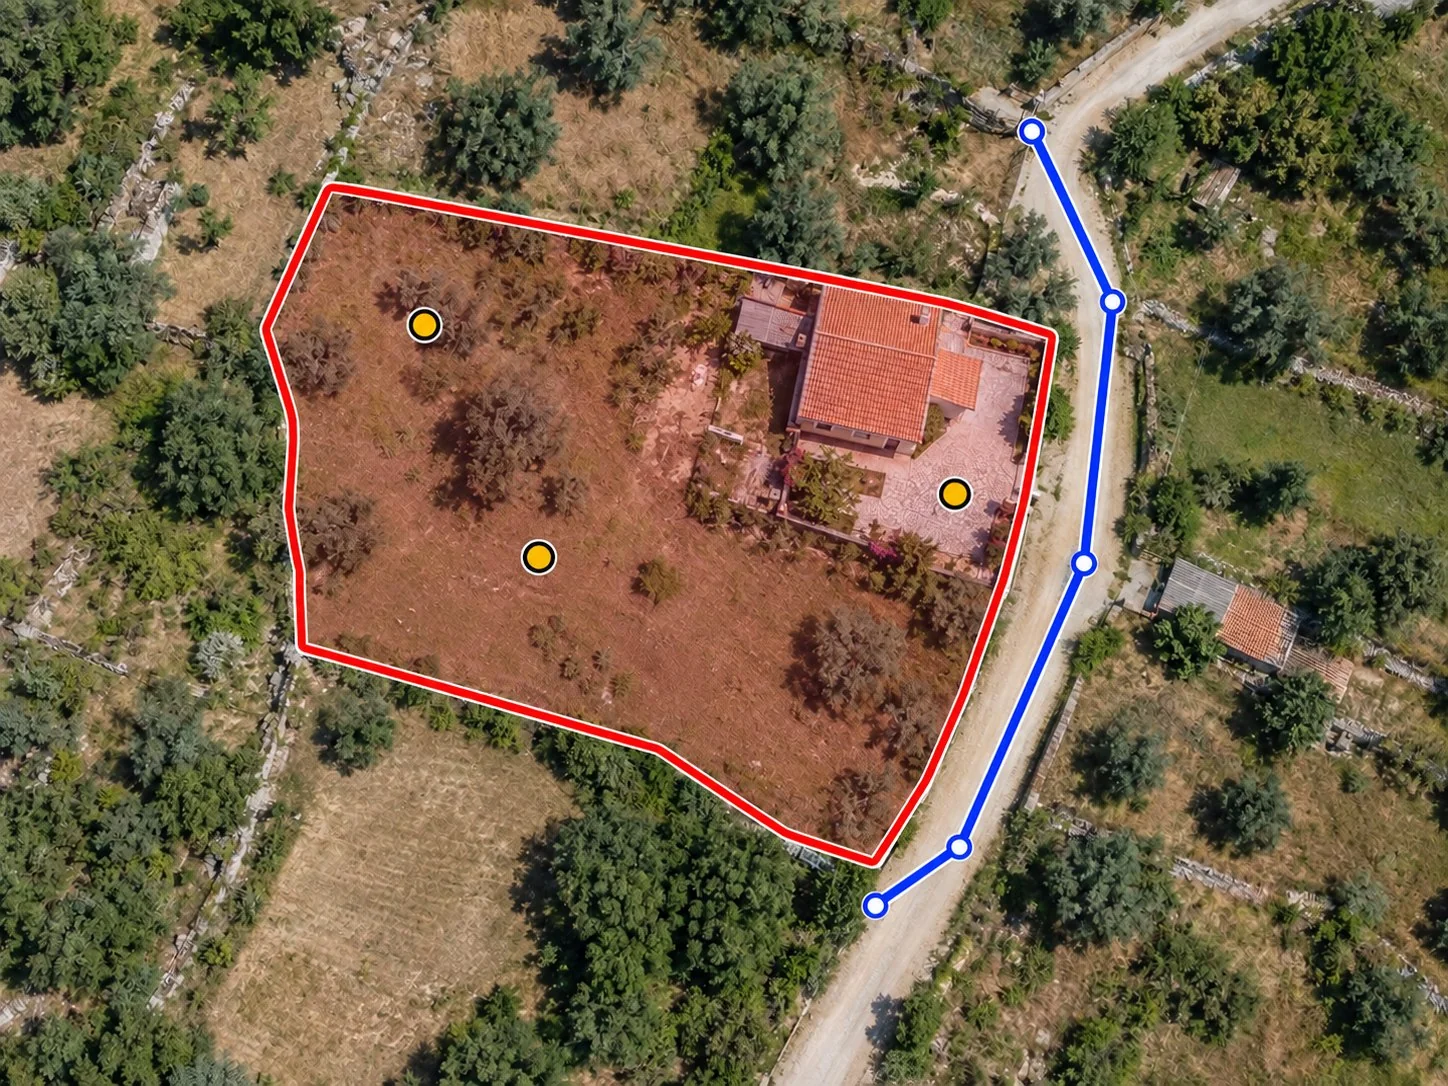
Areas of interest outlined
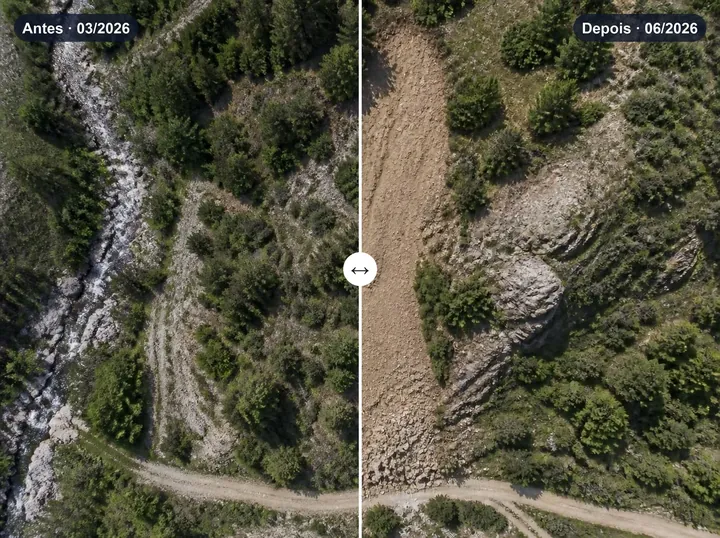
Compare survey images from different dates
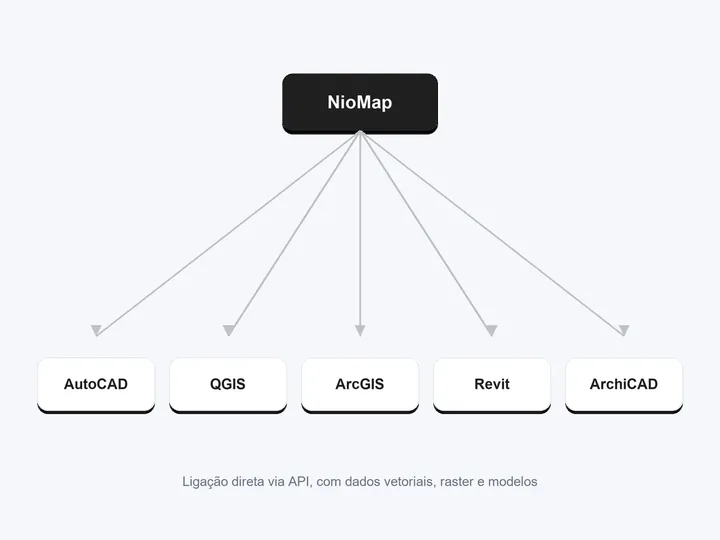
Export via API, as vector and raster
Important note. Assess each source's suitability for the scale and purpose of the analysis.
FAQ
What people usually ask.
Can I use satellite imagery?
Yes. Connect a WMS service of true-colour satellite imagery or vegetation indices such as NDVI, and see them over the survey.
Which formats can I import?
Vector data, rasters, elevation models and WMS or WMTS services.
What if my mapping is in another system?
As long as its coordinate system is identified, the layer is aligned with the survey.
Can I share the map with its layers?
Yes. Anyone with access to the project sees the same layers.
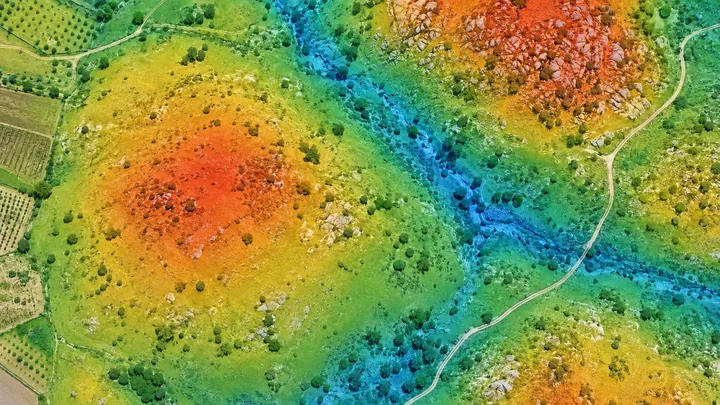
Interpret terrain before fieldwork
Elevation, slope and contour lines of the area, to choose routes, access and zones to observe before the visit.
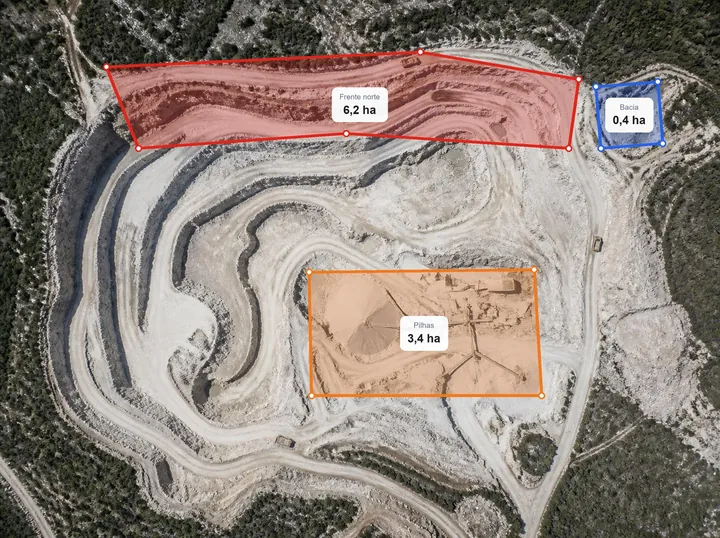
Define and manage operational areas
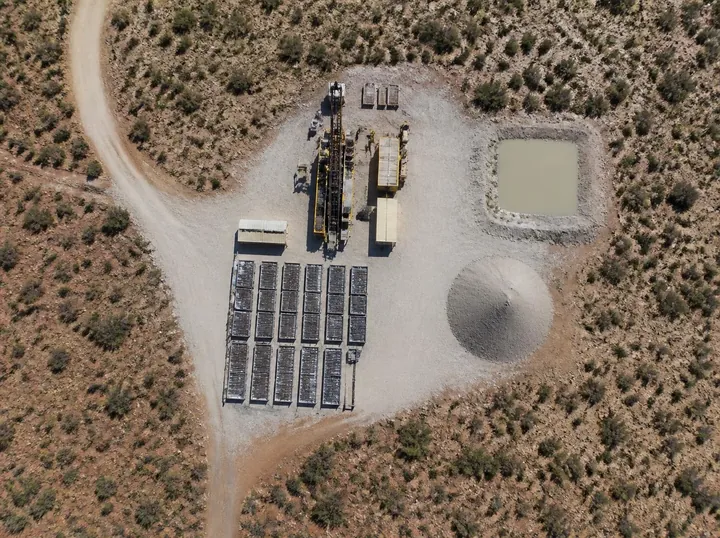
Draw work fronts, stockpiles, ponds and exclusion zones on the survey. The boundaries carry over to the next surveys.
Export results and use integrations
Connect NioMap to AutoCAD, ZWCAD, QGIS, ArcGIS, Aplitop MDT, Revit, ArchiCAD, ARCHLINE.XP or Blender and send orthophotos, models and measurements directly, via API, WMTS or IFC, without converting files.
Bring your mapping into NioMap.
Create a free account and try it with your own survey data: it includes 1 hour of processing and 10 GB of storage. If you have questions, talk to us.