
01Calculate the deposited volume.
Outline the zone and choose the reference: a plane, a base level or the design surface. You get the volume and the height map.
Calculate volumesLandfills and waste sites
Deposited volumes, remaining capacity and cell progress, from drone surveys.
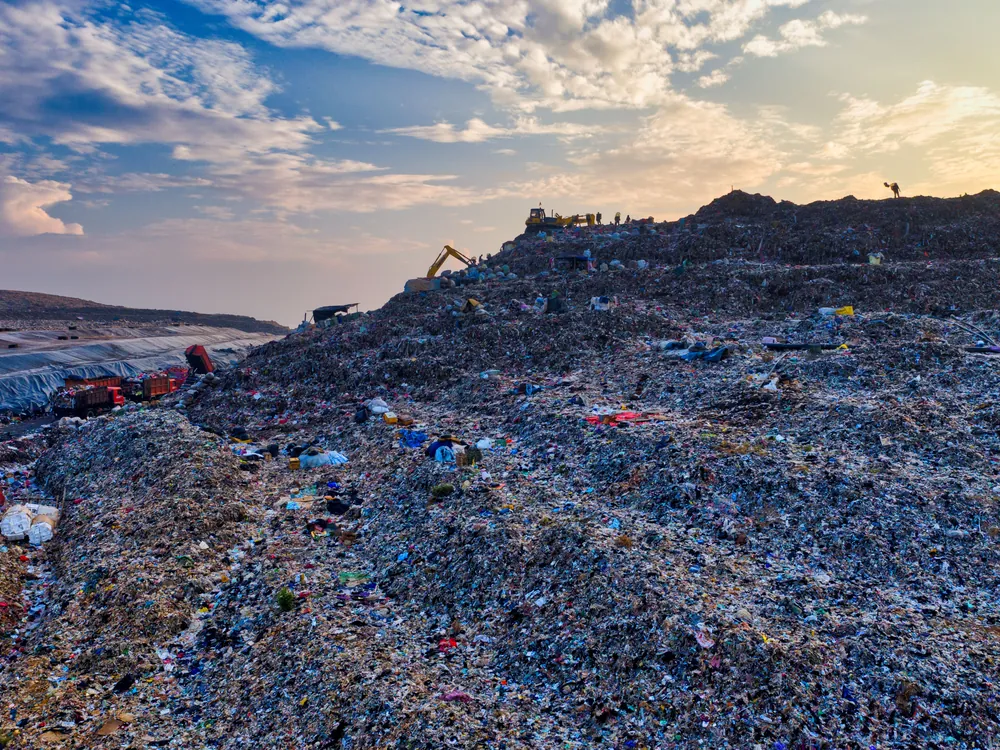
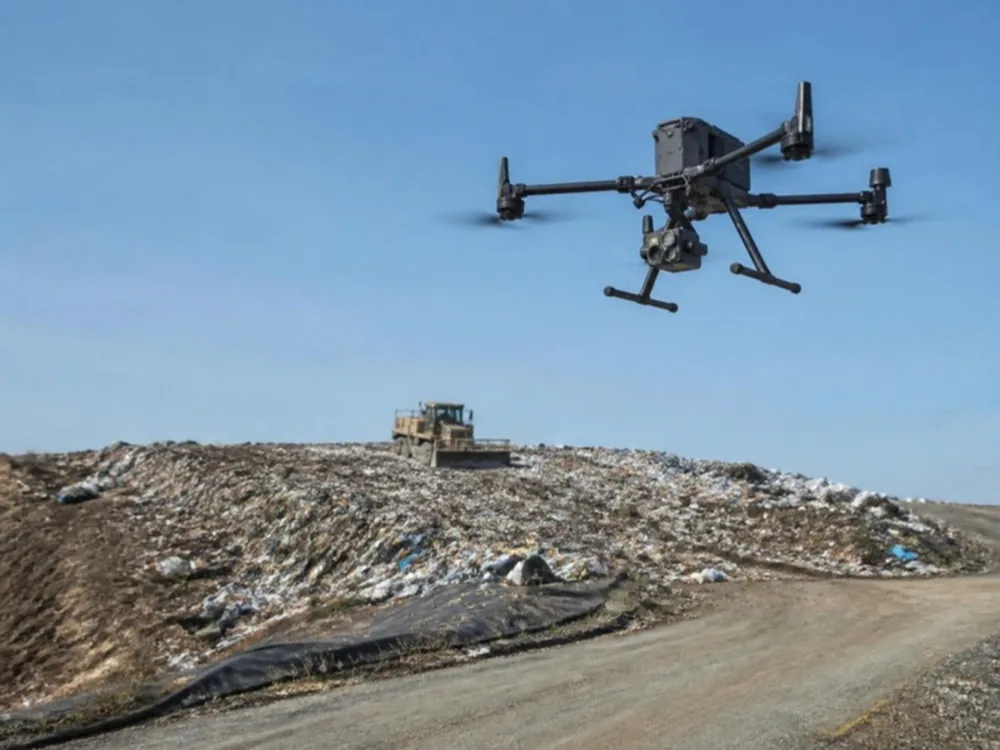
Illustrative scenario
The operator flies the landfill every three months and uploads the data to NioMap. The team calculates the deposited volume, sees the capacity left against the design and generates the report.
Outline the zone and choose the reference: a plane, a base level or the design surface. You get the volume and the height map.
Calculate volumesCompare two dates side by side and measure what changed between them.
Compare surveysEach volume is kept with its date, zone and reference. Open it whenever you need to check it.
Review measurement dataThe current ground is compared with the design surface and the difference gives the volume still left in each cell.
Assess remaining capacityGive the inspectors read-only access. They see the survey and the measurements with their date, with no separate reports.
Share surveys and resultsSend orthophotos, models and measurements directly, via API, WMTS or IFC, to AutoCAD, ZWCAD, QGIS, ArcGIS, Aplitop MDT, Revit, ArchiCAD, ARCHLINE.XP or Blender.
Export results and use integrationsNo account needed
The disposal area and its access roads seen from a drone: open the 2D map or turn the 3D model, in the browser.
Real survey data, shared as an example.
Create a free account and try it with your own survey data: it includes 1 hour of processing and 10 GB of storage. If you have questions, talk to us.