
01Read the relief before going on site.
Elevation, slope and contour lines of the area, to choose routes and zones to observe.
Interpret terrain before fieldworkGeological prospecting
Relief, slope, mapping and areas of interest, from drone surveys.
Illustrative scenario
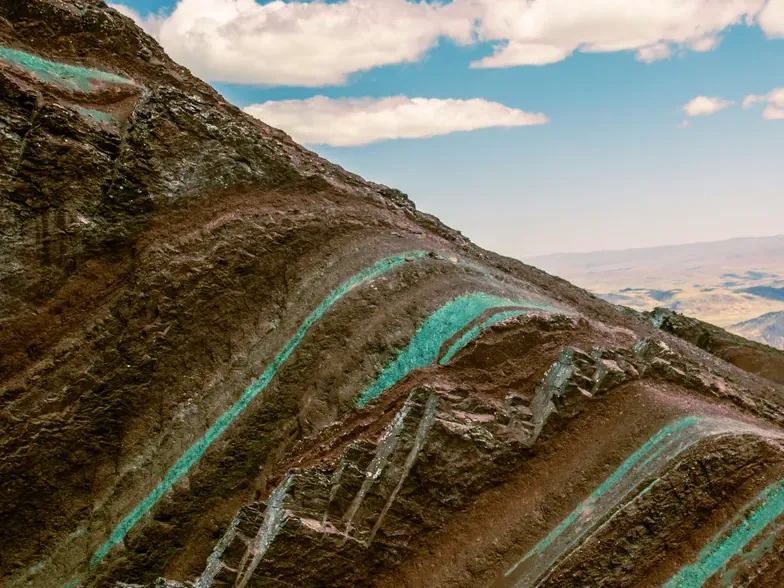
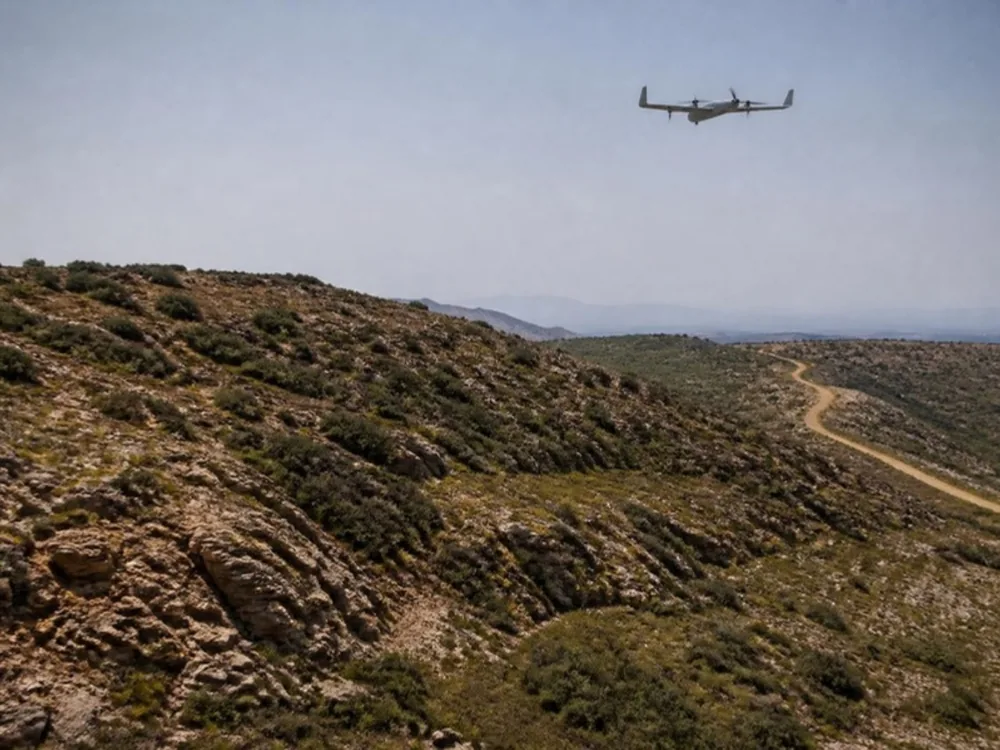
The team flies the area of interest and uploads the data to NioMap. It adds the geological map and samples, reads relief and slope and picks the zones to visit before going to the field.
Elevation, slope and contour lines of the area, to choose routes and zones to observe.
Interpret terrain before fieldworkGeological maps, samples, rasters and WMS or WMTS services over the survey, in the same coordinate system.
Combine mapping and surveysEach zone keeps its name, area and perimeter, and carries over to the next surveys.
Define and manage operational areasCompare two dates side by side and measure what changed between them.
Compare surveysSend orthophotos, models and measurements directly, via API, WMTS or IFC, to AutoCAD, ZWCAD, QGIS, ArcGIS, Aplitop MDT, Revit, ArchiCAD, ARCHLINE.XP or Blender.
Export results and use integrationsInvite each person with the right access or send a link. Everyone sees the same version in the browser.
Share surveys and resultsNo account needed
Open the 2D map or turn the 3D model of a drone survey, in the browser.
Real survey data, shared as an example.
Create a free account and try it with your own survey data: it includes 1 hour of processing and 10 GB of storage. If you have questions, talk to us.