
Solution
Define and manage operational areas
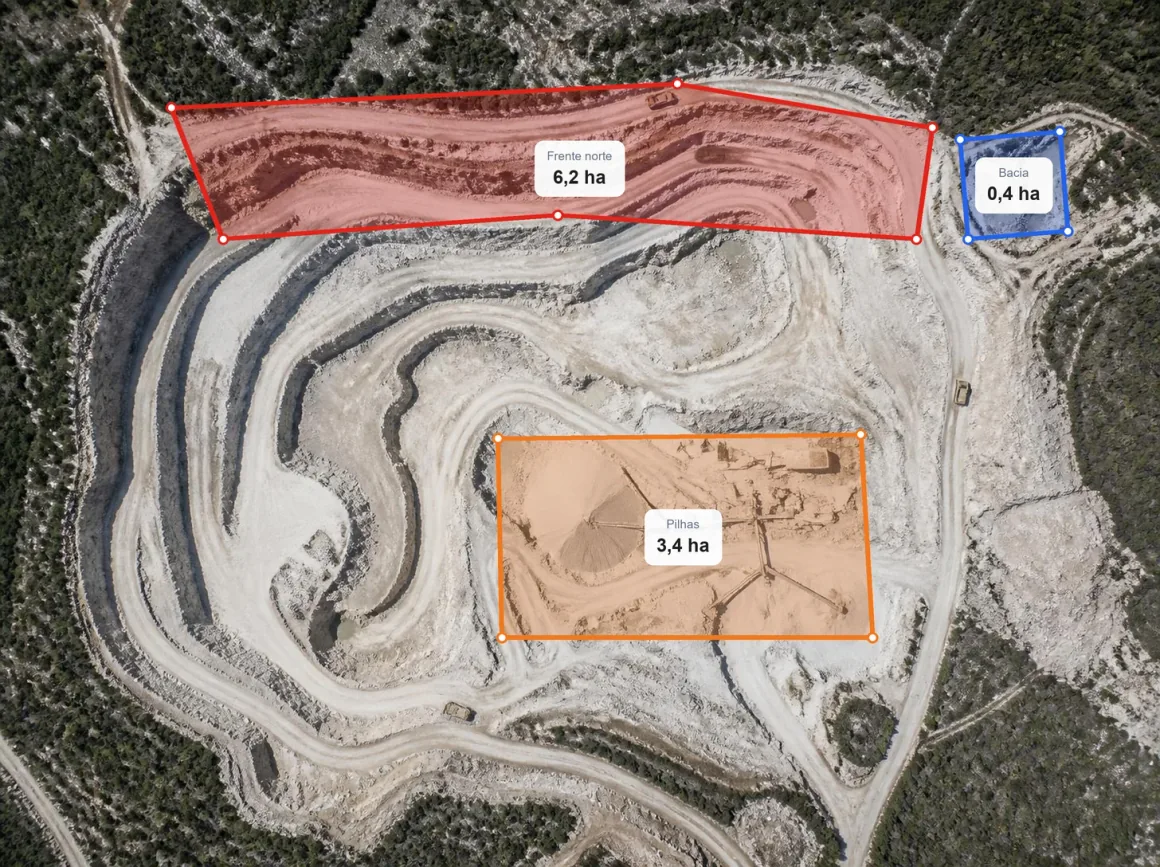
Draw work fronts, stockpiles, ponds and exclusion zones on the survey. The boundaries carry over to the next surveys.
Product
What it's for
Keep the site's zones always on the map.
Each zone has a name, colour, area and perimeter. Look them up before planning work and see them on the latest survey.
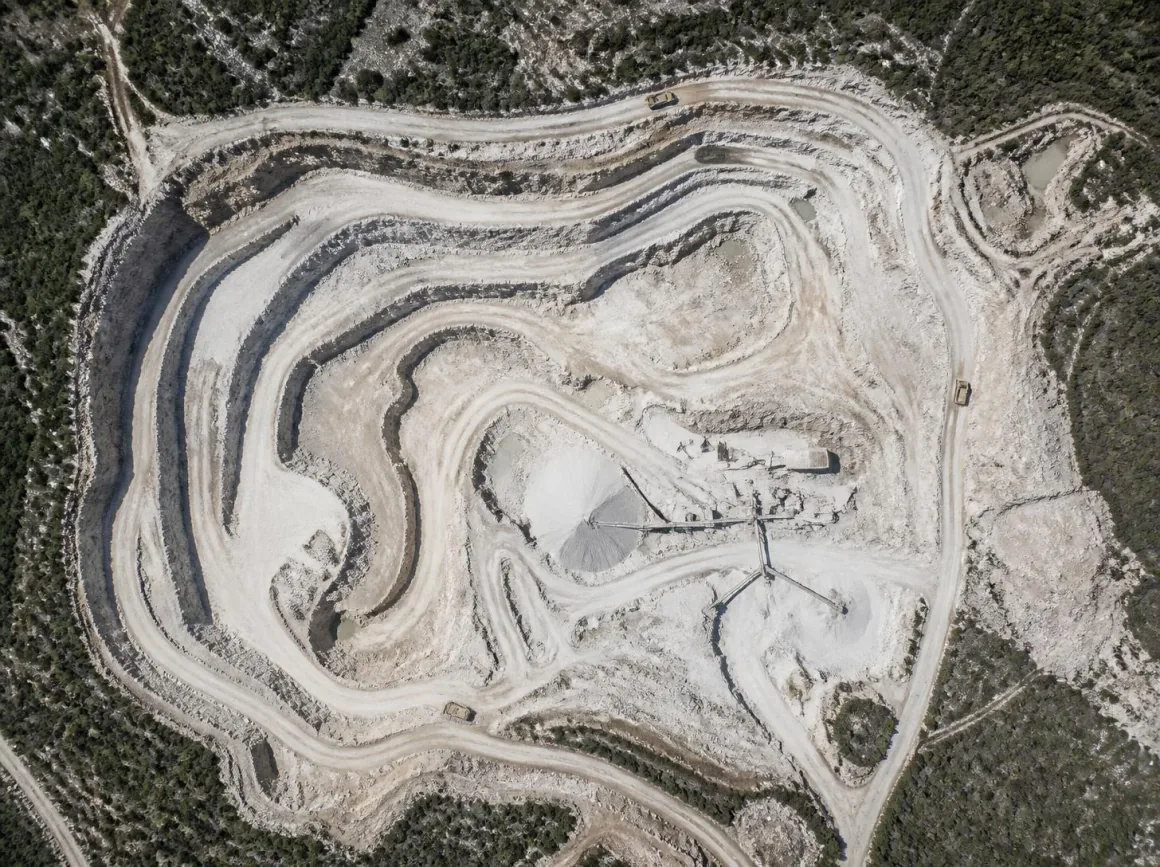
Drag to see the zones.
 SurveyZones
What you need
A recent survey of the site.
Upload the flight data or import the orthophoto already processed. Then draw the zones or import boundaries you already have.
Step by step
- 01
Upload
Upload data or the results from each flight.
- 02
Process
Turn data into results.
- 03
Compare
Compare surveys and see what changed.
- 04
Measure
Measure areas, distances and volumes.
- 05
Share
Share the result with your client or a colleague.
Results
The site's zones on one map.
You keep work fronts, stockpiles and exclusion zones drawn on the latest survey, visible to the whole team.
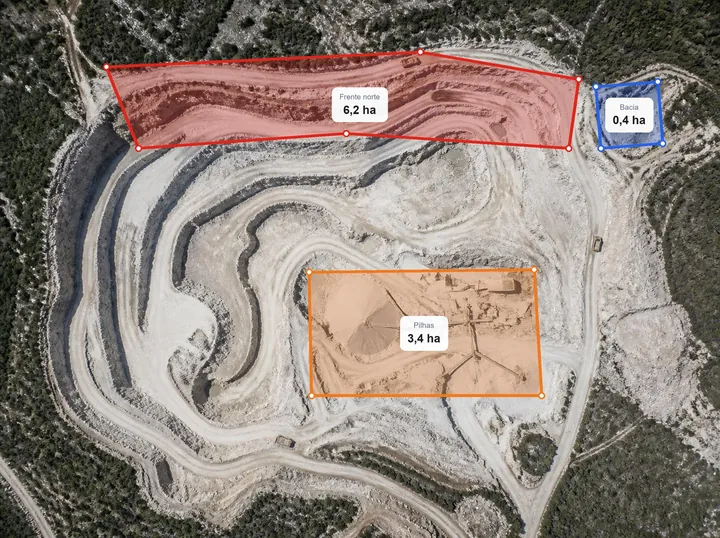
Zones with name and colour
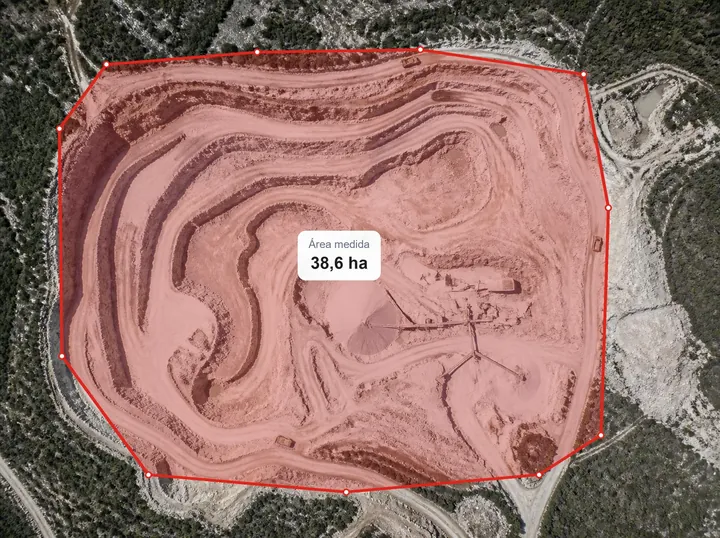
Area and perimeter of each zone
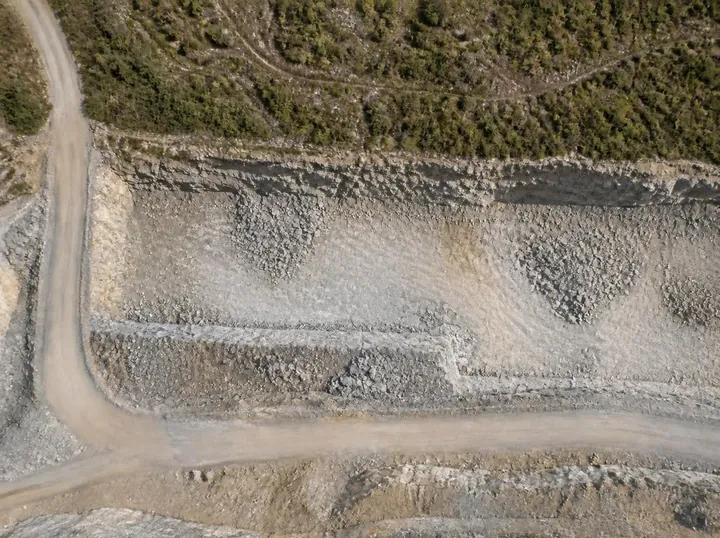
Boundaries that carry over to the next survey
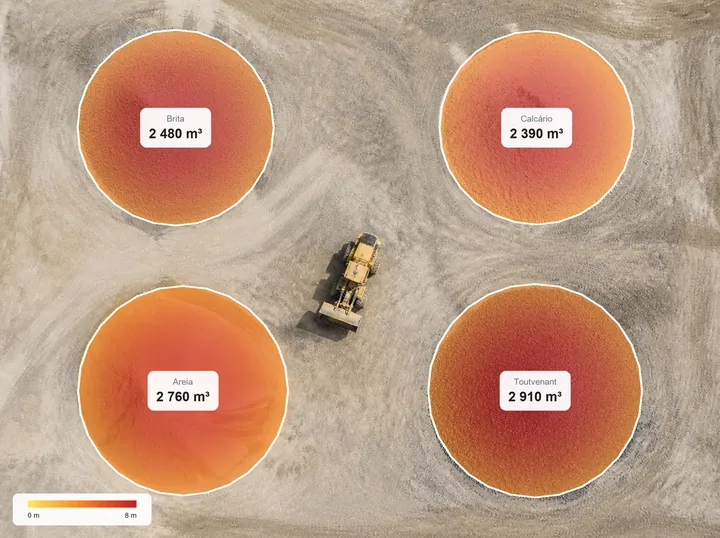
Stockpile volumes

Map shared with the team
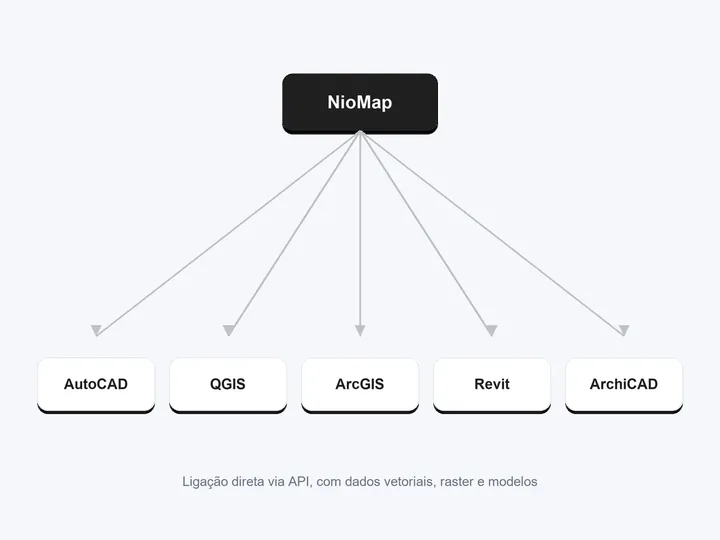
Export via API, as vector and raster
Important note. Operational records do not replace official plans or the responsible professional's validation.
FAQ
What people usually ask.
Do the boundaries carry over to the next survey?
Yes. The drawn zones stay and you can adjust them to the new state of the ground.
Can I import boundaries I already have?
Yes, as vector data, as long as the coordinate system is identified.
Does it replace official plans?
No. It is the team's operational record. Official plans and technical validation still apply.
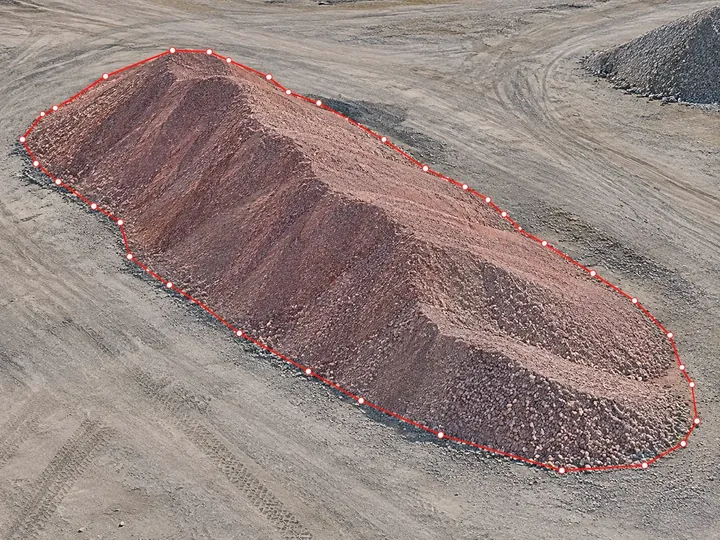
Calculate volumes
Outline the zone and choose the reference: a plane, a base level or the design surface. You get the cut and fill volumes, with a map of each zone.
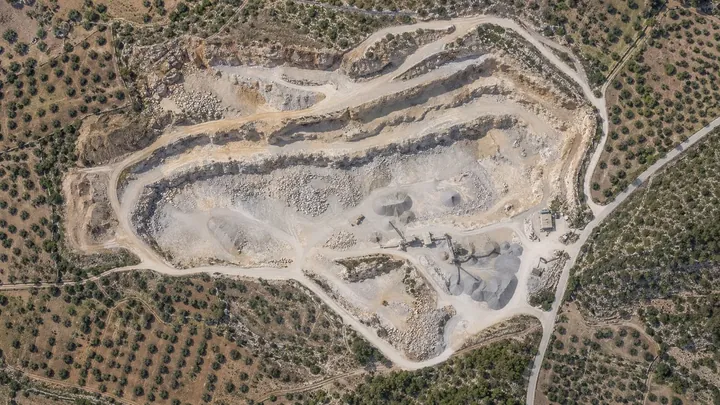
Compare surveys
Get digital 3D maps and models for each uploaded date, and view and measure how the work has progressed between them.
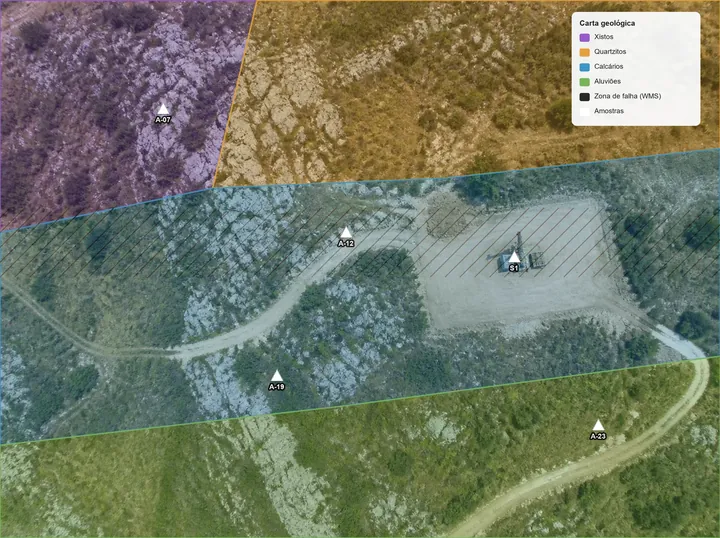
Combine mapping and surveys
Import vector data, rasters and elevation models, or connect WMS or WMTS services such as satellite imagery and vegetation indices, and see them over the survey, in the same coordinate system.
Organise your site's zones in NioMap.
Create a free account and try it with your own survey data: it includes 1 hour of processing and 10 GB of storage. If you have questions, talk to us.