
Solution
Assess remaining capacity
Compare the current survey with the design surface and get the volume used and the volume still left.
Product
Sectors
What it's for
Calculate the remaining capacity of each cell.
With each survey, NioMap calculates the volume between the current ground and the design surface, within the same boundary. Between dates, you see the filling rate.
Drag to see the remaining capacity.
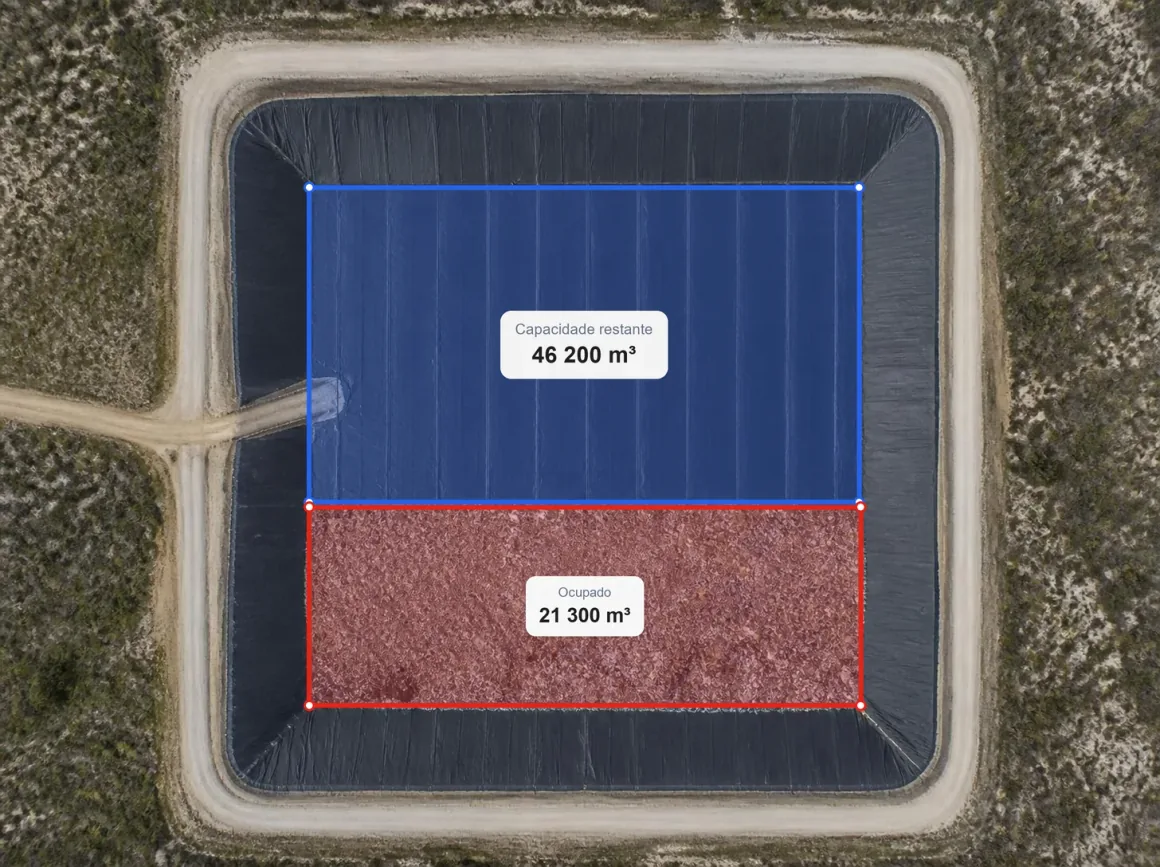
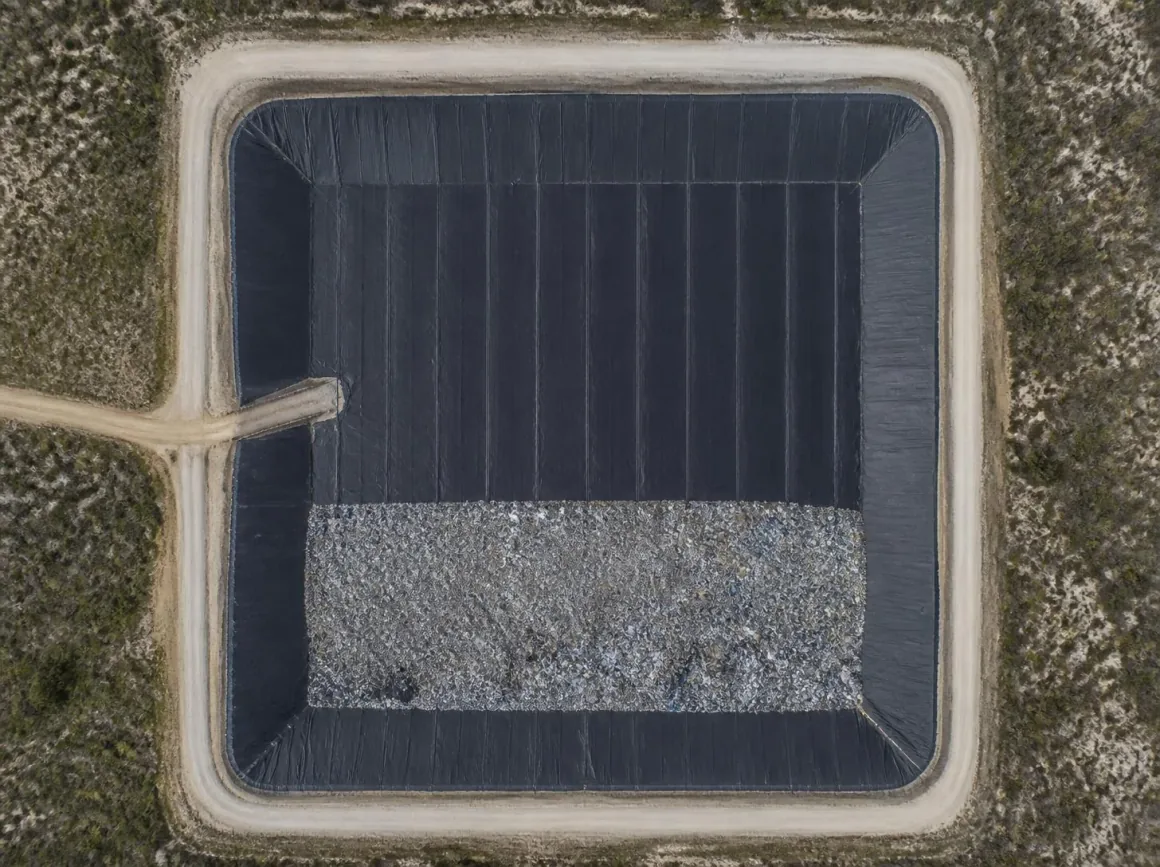 CellRemaining capacity
What you need
A current survey and the design surface.
Upload the flight data and import the design surface of the cell. Always use the same boundary to compare dates.
Step by step
- 01
Upload
Upload data or the results from each flight.
- 02
Process
Turn data into results.
- 03
Compare
Compare surveys and see what changed.
- 04
Measure
Measure areas, distances and volumes.
- 05
Share
Share the result with your client or a colleague.
Results
Used and remaining, at each date.
You keep the volume used, the remaining capacity and the filling rate between surveys, ready to look up, share or export.
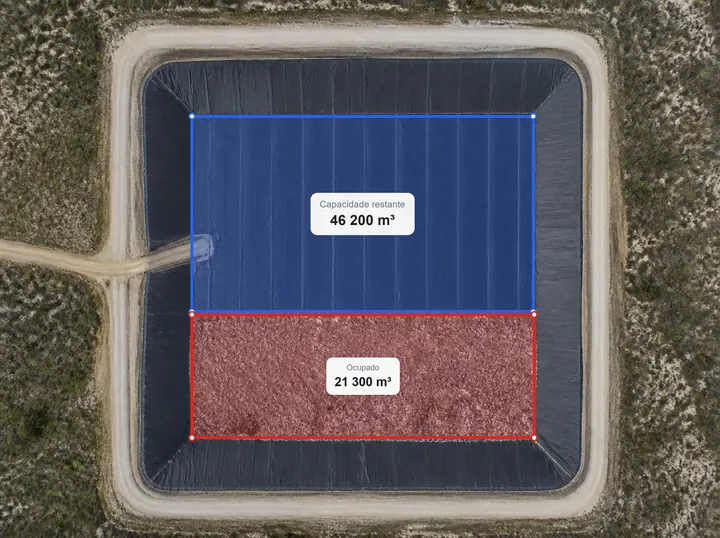
Remaining capacity in m³
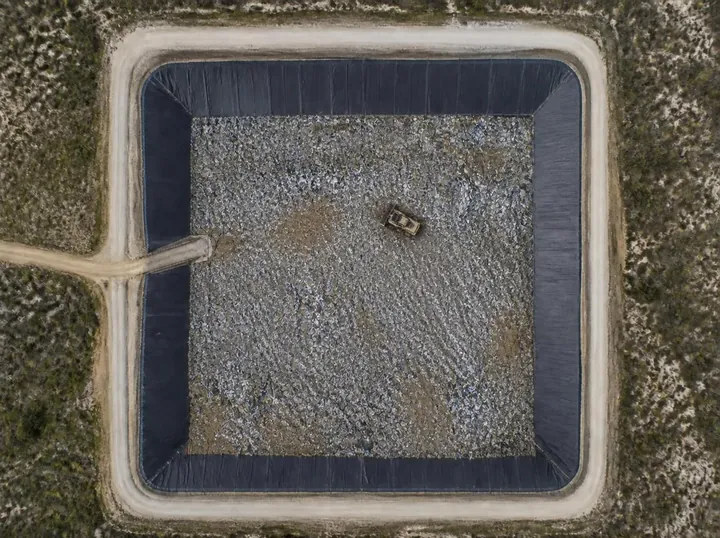
Volume used by date
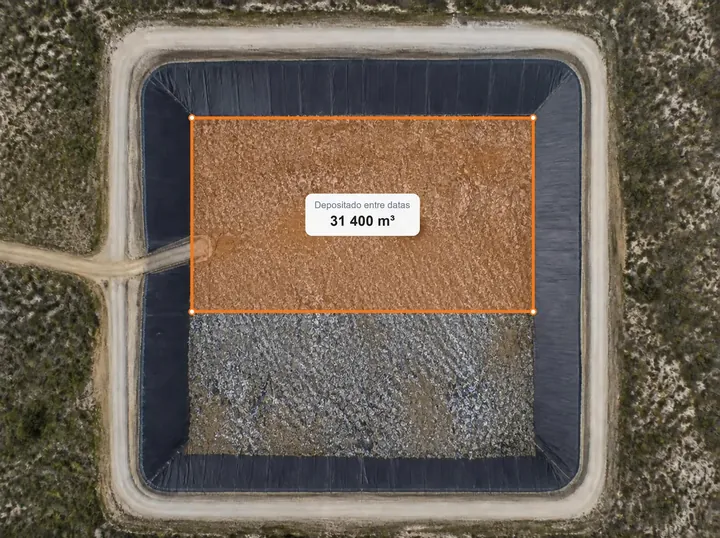
Filling rate between surveys
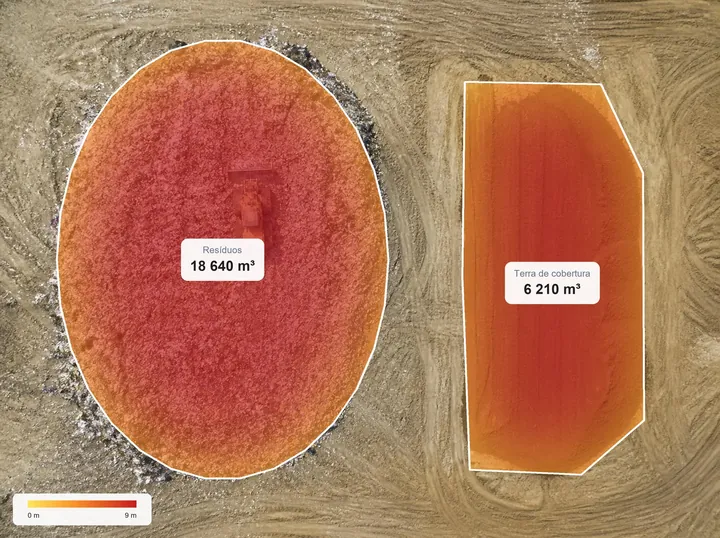
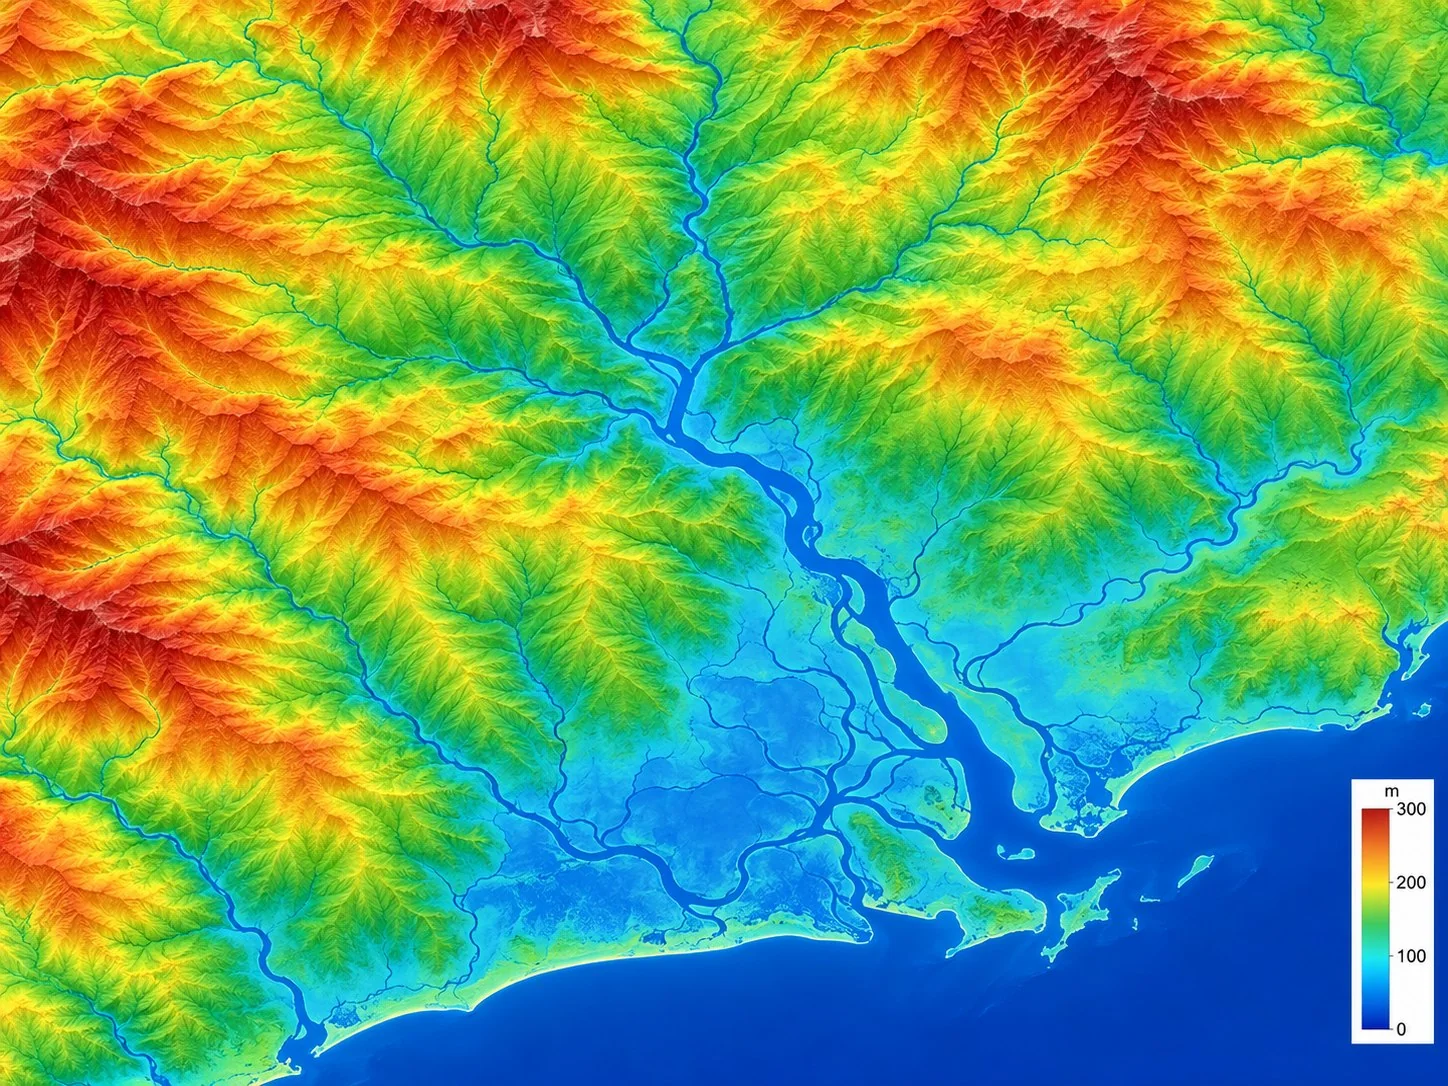
Height map of the cell
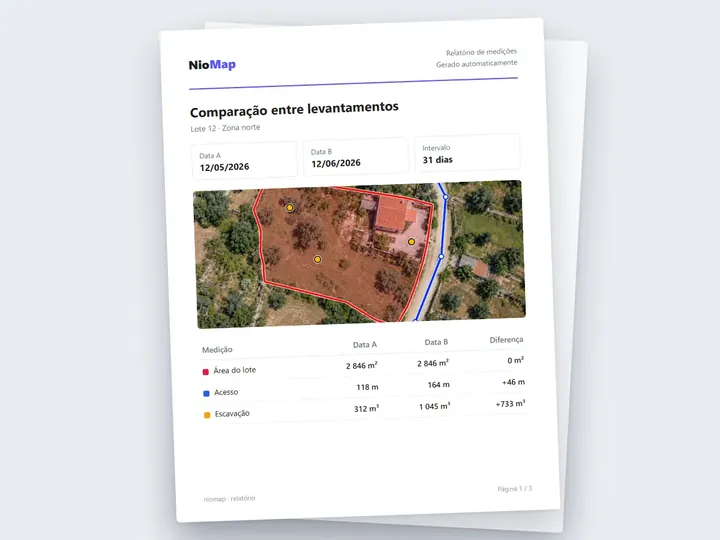
Automatic report with the volumes

Sharing with the inspectors
Important note. Calculated geometric capacity does not by itself determine the site's authorized capacity.
FAQ
What people usually ask.
Which surface is the reference?
The design surface of the cell, which you import into NioMap.
Can I follow the filling rate?
Yes. With two or more surveys, you see the volume deposited between dates.
Is the figure the authorised capacity?
No. It is the calculated geometric capacity. The authorised capacity depends on the site's licence.
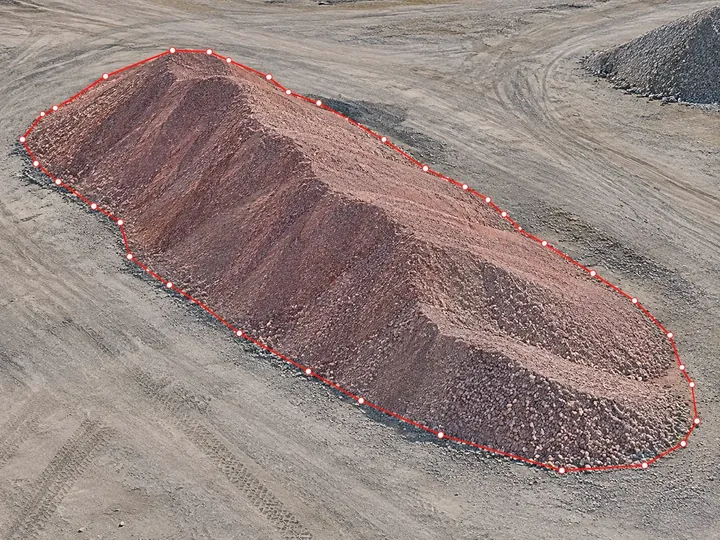
Calculate volumes
Outline the zone and choose the reference: a plane, a base level or the design surface. You get the cut and fill volumes, with a map of each zone.
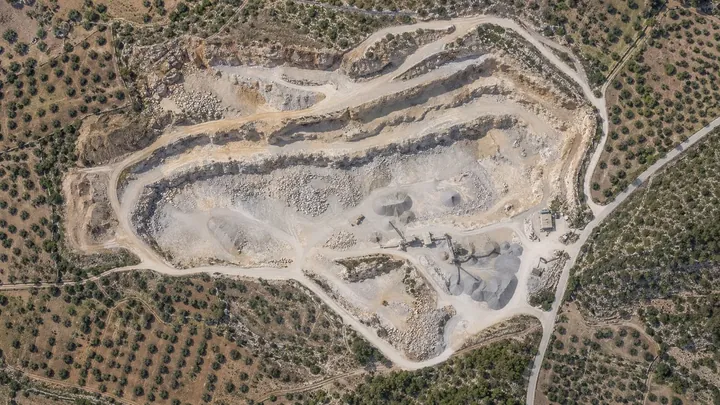
Compare surveys
Get digital 3D maps and models for each uploaded date, and view and measure how the work has progressed between them.
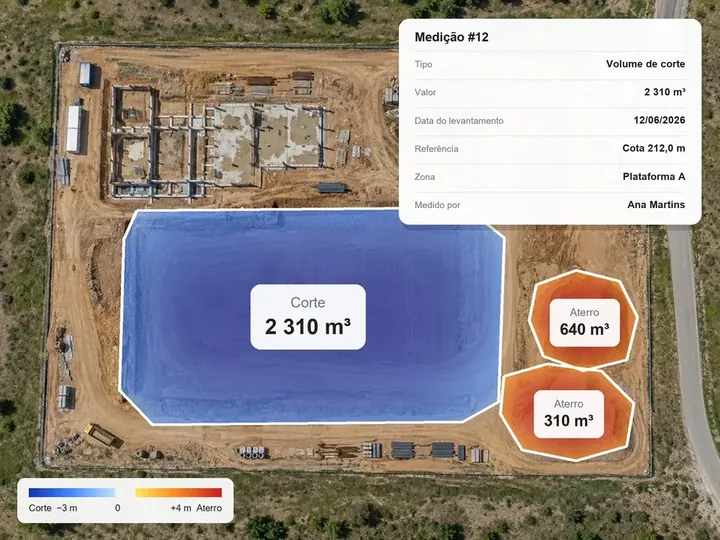
Review measurement data
Each measurement is kept with its value, survey date, zone and reference. Open it whenever you need to check it.
Track your landfill capacity in NioMap.
Create a free account and try it with your own survey data: it includes 1 hour of processing and 10 GB of storage. If you have questions, talk to us.