
Solution
Analyze slopes
Slope is calculated from the elevation model and shown in classes, from flat to steepest.
Product
Sectors
What it's for
Know where the ground is steepest.
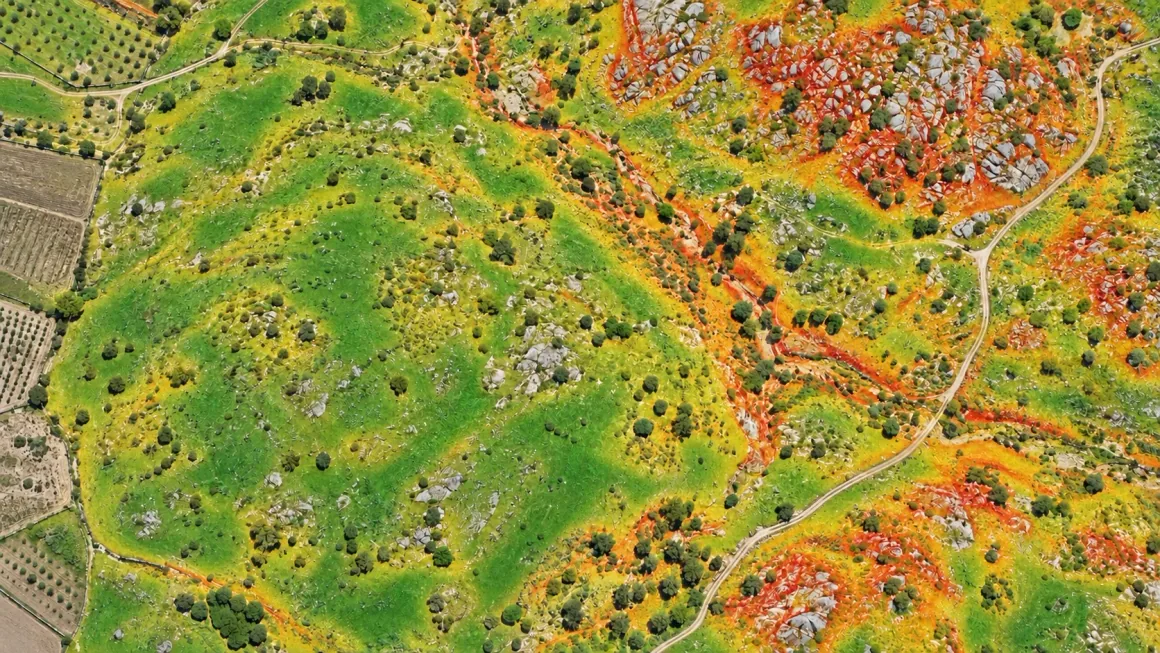
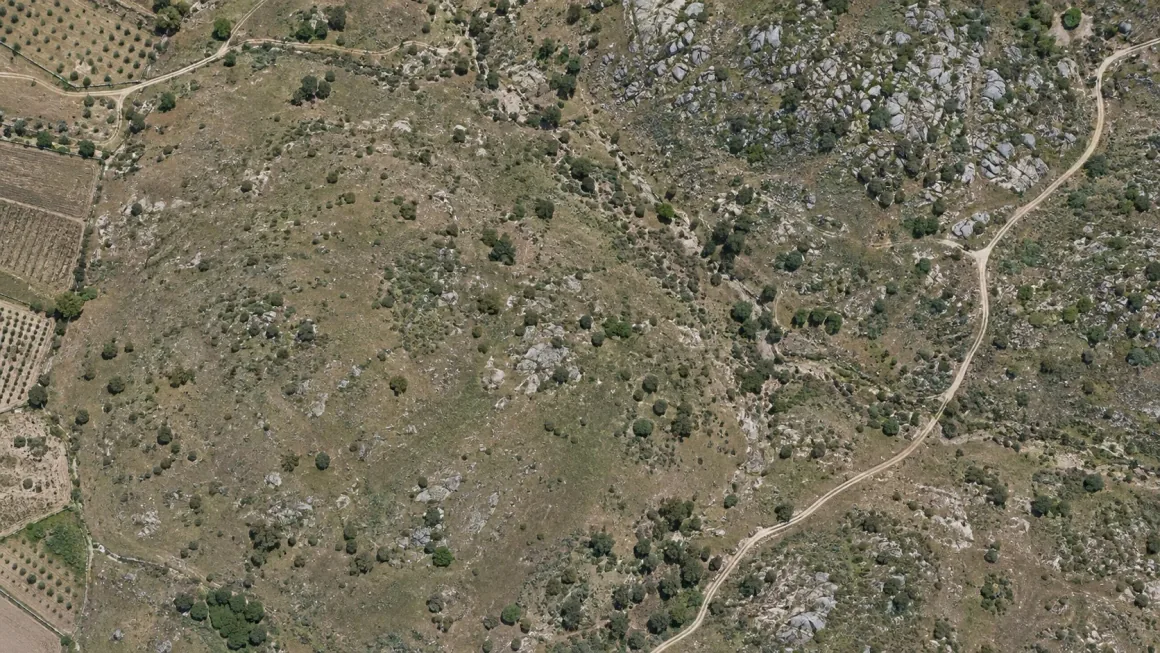
The slope map shows, in colours, the flat and the steepest zones. Add contour lines and profiles where you need more detail.
Drag to see the slope map.
 OrthophotoSlope map
What you need
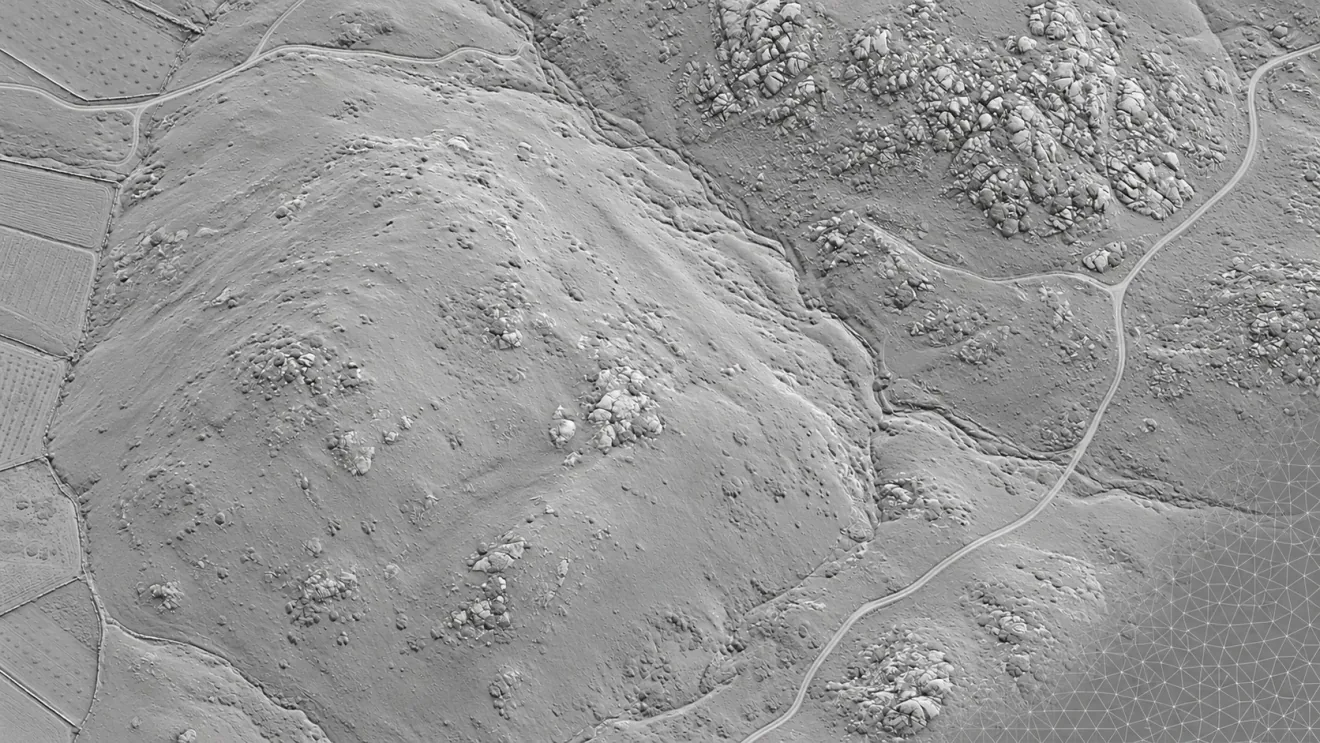
An elevation model of the area.
Upload the flight data or import the model already processed. An orthophoto of the same area helps you recognise the ground.
Step by step
- 01
Upload
Upload data or the results from each flight.
- 02
Process
Turn data into results.
- 03
Compare
Compare surveys and see what changed.
- 04
Measure
Measure areas, distances and volumes.
- 05
Share
Share the result with your client or a colleague.
Results
The slope of each zone, visible on the map.
You keep the slope map, contour lines and profiles with the survey, ready to look up, share or export.
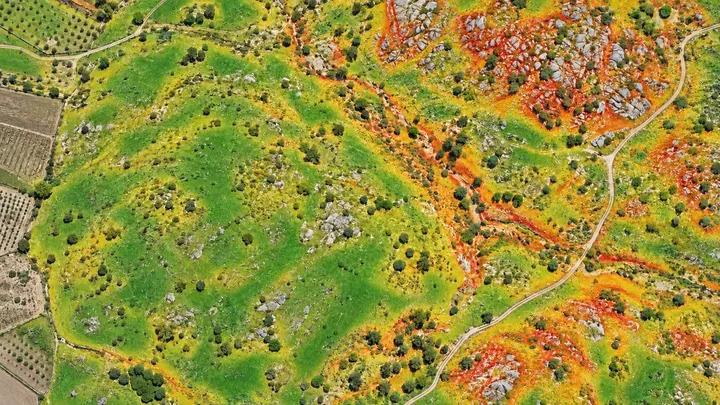
Slope map by classes
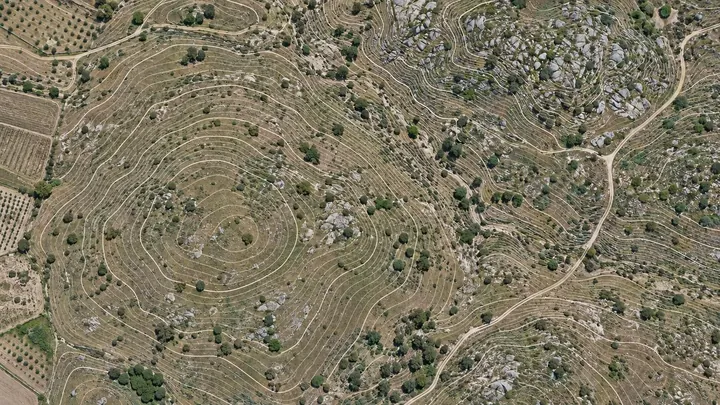
Contour lines
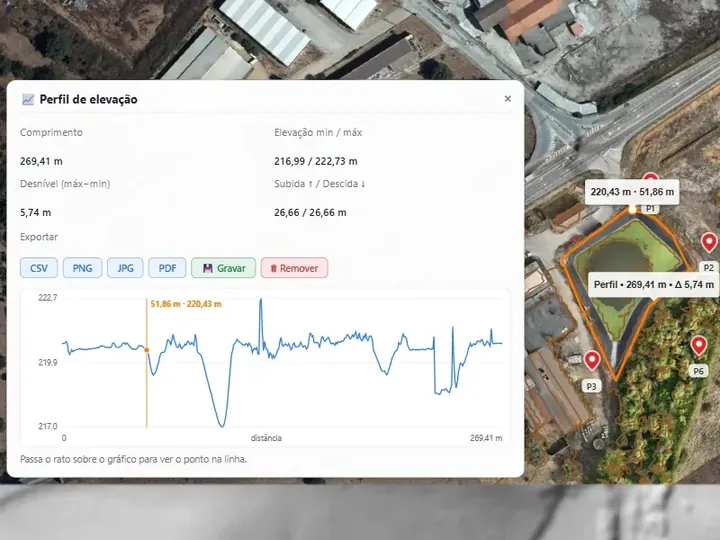
Terrain profiles
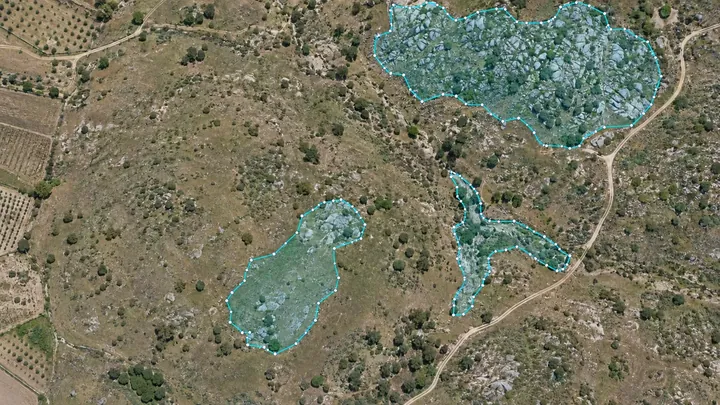
Steep zones outlined
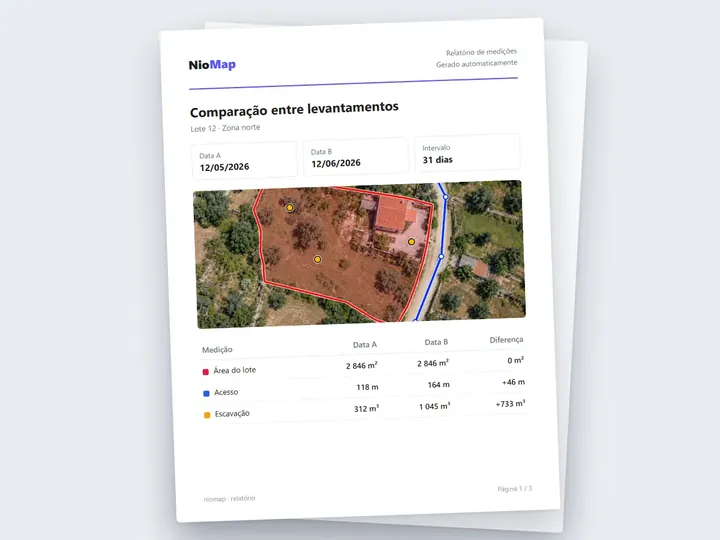
Report with the measurements
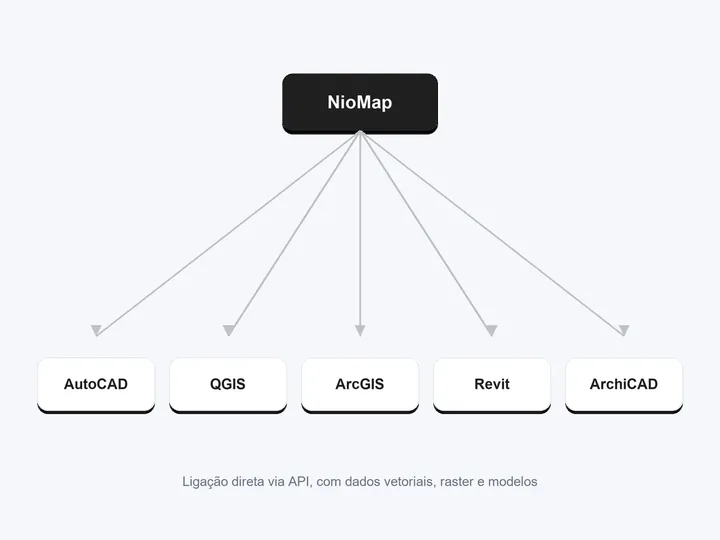
Export via API, as vector and raster
Important note. A slope layer does not replace a drainage, stability or safety study.
FAQ
What people usually ask.
How is slope calculated?
From the survey's elevation model, point by point, and shown in slope classes.
Is a photograph enough?
No. Slope needs the elevation model. The orthophoto provides context.
Can I see the profile of a steep zone?
Yes. Draw a line on the map and the profile is calculated automatically.
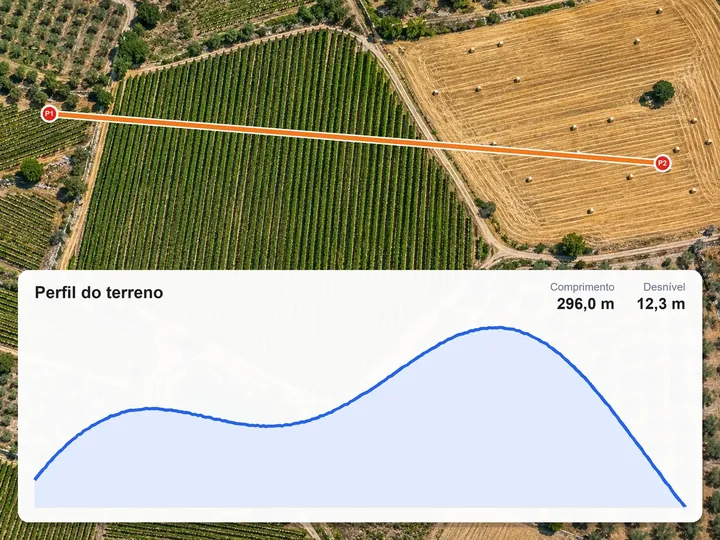
Measure elevations, distances and profiles
Mark points or draw a line on the map and get elevations, distances and the terrain profile, with its length, elevation difference and slope.
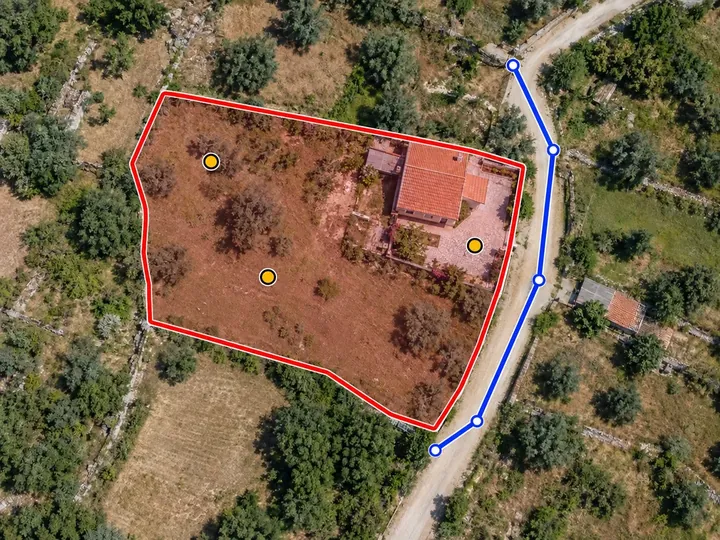
Measure areas
Draw the boundary of any zone on the map and get its flat area, its real (3D) area and its perimeter. The measurement is kept with the survey and its date.
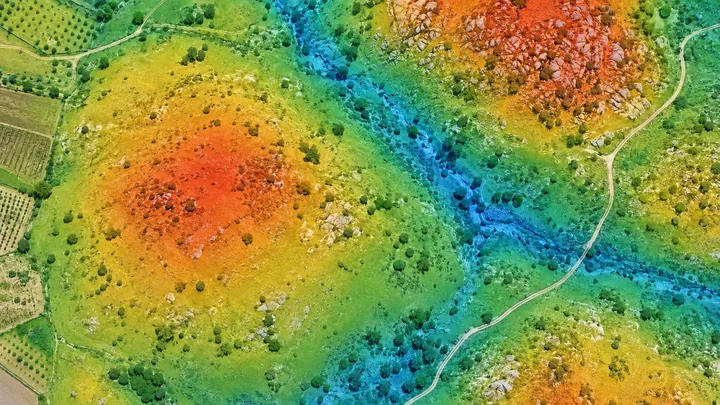
Interpret terrain before fieldwork
Elevation, slope and contour lines of the area, to choose routes, access and zones to observe before the visit.
See the slope of your ground in NioMap.
Create a free account and try it with your own survey data: it includes 1 hour of processing and 10 GB of storage. If you have questions, talk to us.